The prefill that freezes your decoders, and the flag that mostly fixes it
Part 2 of “The Inference Wall”. Same rig as Part 1: Qwen3.5-4B, fp16, one NVIDIA A10G (23 GB), under real load.
Manas Pathak · August 28, 2026
The Inference Wall · All posts · Part 2
When you self-host a language model, the server does not answer one request at a time. It runs many requests together on the GPU at once, which is the whole reason one GPU can serve many users. But sharing has a downside: one request can degrade the experience of every other request sharing the GPU with it, without anything crashing or erroring. This post is about the most common version of that problem, one big request quietly freezing everyone else’s answer mid-sentence, and about the one setting that controls it.
Concretely, picture a chat server. Most requests are short and already streaming their answers back word by word. Then one user pastes in a 6,000-word document and asks for a summary. Watch what happens to everyone else: their streams stall. Tokens that were arriving every 20 milliseconds suddenly take most of a second to show up. The users who did nothing wrong feel the model “stutter,” and it is entirely the fault of the one big request that arrived.
Here is the result this post lands, measured on the same rig as Part 1: one 6,000-token prompt dropped into a stream of short requests inflates the worst-case stutter of every other request on the server into most of a second, and flipping a single scheduler setting cuts that back by about 2.4x. Then we open a profiler trace and watch the freeze happen kernel by kernel. If you have not read Part 1, all you need is its punchline: this 4B model, on one mid-range GPU, is slow enough per token that a big prompt is genuinely expensive, which is exactly why this effect is visible at all. More on that at the end.
Why a big prompt freezes everyone else
Recall the two phases from the primer. Prefill reads a whole prompt in one dense burst, so a long prompt is a big, expensive lump of work. Decode emits the answer one cheap token at a time. On this 4B model a decode step is ~20 ms; a 6,000-token prefill dwarfs it.
The problem is that both phases compete for the same engine steps. A serving engine like vLLM runs one loop: each turn of the loop is one step, one pass through the model’s weights, and the scheduler decides what work rides in it. When a fat prefill lands, the scheduler faces a choice. Let the prefill occupy whole steps to itself until all 6,000 tokens are read, or make it share? If prefill gets whole steps, every currently streaming request emits nothing until it clears, because their next token needed a step and the steps were taken. That is the freeze. The victims did nothing wrong; they just happened to be decoding when a big prompt arrived.
What chunked prefill actually does
The fix is called chunked prefill, and it is worth being concrete about the mechanism rather than waving at the name.
A prompt does not have to be read in one go. Prefill over 6,000 tokens produces the same cached state whether the model processes all 6,000 in one pass or in slices, as long as the slices run in order; each slice reads its tokens against the state the earlier slices already built. So the scheduler is free to cut the lump.
With the flag on, the scheduler sets a per-step token budget and packs each step as a mixed batch. First the decode work: every streaming request contributes its one next token, and those always ride along. Whatever budget remains in the step is filled with the next slice of any pending prefill. A 6,000-token prompt might become a dozen or so slices spread over a dozen or so steps, each step also carrying every decoder’s next token. The prefill finishes slightly later than it would have with the steps to itself, and in exchange nobody’s stream ever stops.
Two consequences follow directly, and both show up in the measurements below. The decoders never fully halt, but each step now carries prefill freight alongside their tokens, so a step takes longer than a pure-decode step: the freeze becomes a slowdown. And the trade has a dial, the per-step budget. A small budget slices thinner, protecting the decoders more but stretching the prompt’s own time-to-first-token; a large budget approaches the monolithic behavior. vLLM’s modern scheduler ships with all of this on by default; the experiment below turns it fully off against fully on, the two ends of the dial.

The experiment: victims and an injected lump
To measure the freeze, the probe plays out exactly the chat-server scenario. It runs 6
short streaming “victim” requests continuously and records their inter-token latency,
or ITL: the gap between consecutive output tokens, which is what a user experiences as
smoothness. Midway through, it injects a batch of long prompts of about 6,000 tokens
each, then keeps recording the victims’ ITL. The whole thing is run twice: once with the
server started with --enable-chunked-prefill, once with --no-enable-chunked-prefill,
everything else identical. The number that matters is the victims’ ITL p99:
the worst-case stall the injected prefill inflicts on the requests that were already
streaming.
The clean, reproducible comparison is the heavy injection, 12 long prompts arriving at once, run twice for stability:
| Condition | Victim ITL p50 | Victim ITL p99 |
|---|---|---|
| Chunked prefill ON, heavy (12) | 21.3 ms | 345 / 348 ms |
| Chunked prefill OFF, heavy (12) | 21.2 ms | 831 / 833 ms |
Read the p50 column first: it does not move. In the median, both configs stream at about 21 ms per token, and if you only watched average latency you would never know anything was wrong. The entire effect is in the tail. With chunked prefill OFF, the victim ITL p99 is about 830 ms: the worst tokens take most of a second to arrive, because that victim request was stuck waiting behind a whole monolithic prefill. Turn chunked prefill ON and the p99 drops to about 345 ms, a 2.4x reduction in the worst-case stutter. Both runs land within a few milliseconds of each other, so this is a stable result, not noise.
That is the headline: on a real model, this one flag cuts the worst-case stutter that big prompts inflict on everyone else by about 2.4x.
The twist: on a small model this flag does nothing
Here is the honest part, and it is where most benchmarks would mislead you. The same probe on a smaller model, Qwen2.5-0.5B, a prior-generation half-billion-parameter model I keep around as a small-scale foil, showed no measurable difference at all. Chunked prefill looked like a no-op.
It was not that the flag was broken. It was that on a 0.5B model a decode step is only 3 to 5 ms, and even a monolithic 6,000-token prefill gets absorbed so fast that vLLM’s default scheduler interleaving already hid the whole problem. There was no freeze to fix because the lump was small relative to nothing.
On the 4B, a decode step is ~20 ms and a 6k prefill is a genuinely heavy chunk, so whether the scheduler slices it or not becomes visible in the victim tail. Same feature, same default, opposite conclusion, purely because the model got bigger. The lesson generalizes: whether you can measure a scheduling optimization’s benefit depends on the ratio of the interfering work to the step you are protecting, here the prefill against the decode. Benchmark it on too small a model and you will “prove” it does nothing.
An honest measurement trap: how you count the tail changes the answer
There is a subtlety here worth dwelling on, because I got it wrong the first time and only caught it by re-running with the raw numbers saved. I also ran a light injection of 3 long prompts instead of 12. At that level, if you compute the p99 over all the victim tokens across the whole run, chunked-prefill-OFF actually looks slightly better than ON, about 103 ms against 325 ms, the opposite of the real effect.
That is not chunked prefill failing. It is an artifact of how the tail is measured. With OFF and only 3 injected prompts, the freeze is severe but brief: a handful of victim tokens stall for ~800 ms, but there are so few of them, against ~1,900 total streamed tokens, that they fall outside the worst 1% and never reach the p99. ON, by contrast, spreads a milder ~300 ms elevation across many more tokens, so its p99 sits higher even though no single token ever stalls as badly. Restrict the measurement to the injection window, the tokens actually streaming while the prefill is in flight, and OFF’s p99 jumps back to ~825 ms, exposing the real stall.
The lesson is a benchmarking one, not a chunked-prefill one: a percentile is only meaningful relative to the population you compute it over. A rare severe stall can hide under an overall p99 while dominating a windowed one. The heavy-injection comparison above avoids the trap entirely, because enough tokens are affected that the stall shows up no matter how you slice it, which is exactly why it is the number to trust and the one to headline.
The trace: showing the freeze instead of inferring it
The ITL numbers imply the prefill stalls the decoders. A trace shows it. Serving was
re-run with vLLM’s torch profiler armed, one ~6k-token prompt injected amid 4 steady
victim decode streams, and the profiler stopped after a few engine steps. This is a
separate, lighter capture than the 6-victim probe above, kept small so the trace stays
openable in a browser. It captured 36,794 GPU kernel events, and the whole thing is
downloadable: the trace file lives in
benchmarks/02-prefill-freeze/
as chunked_prefill_trace.json.gz, and you can open it yourself in
ui.perfetto.dev or chrome://tracing with no GPU and nothing
installed; gunzip it and drag it in. Three things fall out of it.
1. The hybrid architecture is legible in the kernel mix. A kernel is one unit of work
the GPU runs; the trace is just the list of them, and the kernel names below are vLLM’s
internal labels. You do not need to decode them, only to notice which layer type each
belongs to. The decode streams run fused_recurrent_gated_delta_rule kernels, the
linear-attention layers doing their fixed-size-state update from Part 1: 408 calls,
averaging 37 microseconds each. The injected prefill runs chunk_gated_delta_rule and
chunk_fwd kernels, the same layers processing a whole prompt in bulk rather than one
token at a time: 13,905 calls, about 1.74 seconds of CUDA time total. That single 6k-token prefill issues roughly 34x more kernel launches
than the entire decode stream it is crashing into. It really is the heavy lump the ITL tail
implied, and you can count it.
2. The freeze becomes a slower heartbeat, and you can watch it. The engine advances in steps, and the full-attention layers leave a per-step signature in the trace: their kernels fire in one tight burst each step, whatever kind of step it is. Clustering those bursts reconstructs the step cadence straight from the trace. Here is that cadence around the moment the injected prompt finishes; every tick is one engine step at its true timestamp:
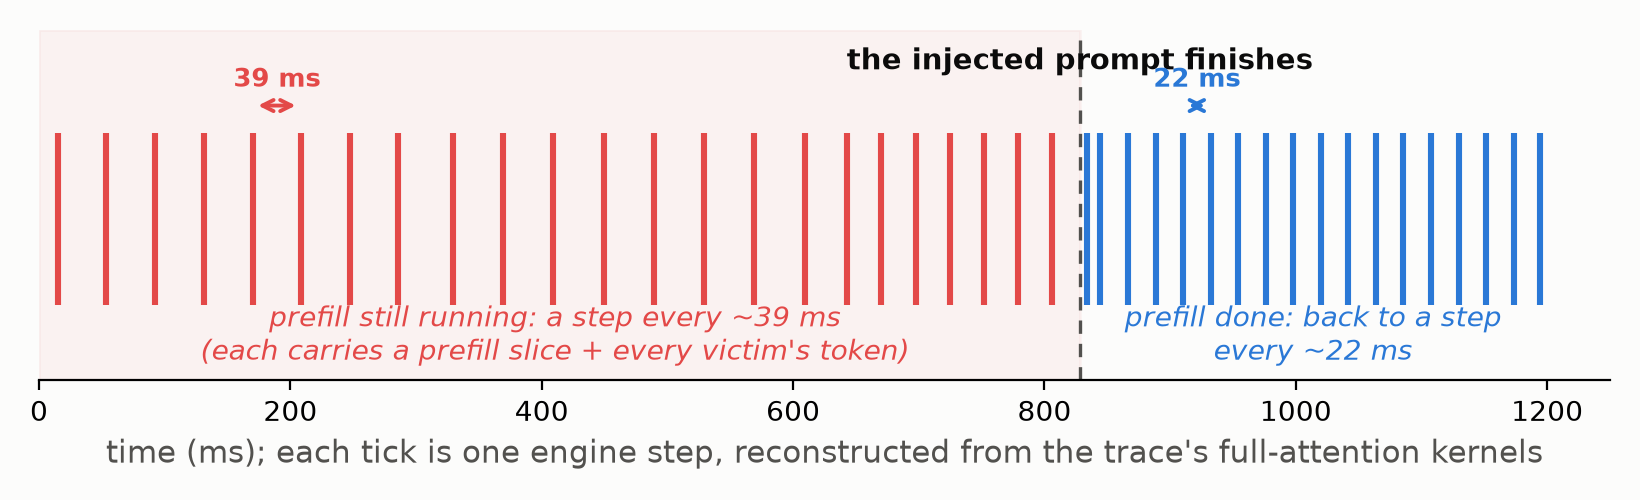
This is the whole chunked-prefill trade in one picture. While the injected prompt is being sliced in, the victims’ steps come every ~39 ms instead of ~22: each of those steps is a mixed batch carrying a prefill slice alongside every victim’s next token, so every beat is slower, but the beat never stops. The instant the prompt’s last slice clears, the cadence snaps back to ~22 ms, which matches the 21.3 ms ITL the clients measured. Elevated but bounded, exactly what the client-side tail said, now visible as the GPU’s own step rhythm. Because this capture is lighter than the client-side runs above, one prompt and 4 victims instead of 12 and 6, its absolute numbers do not line up with the 345 ms client tail, and they should not. What matches is the shape.
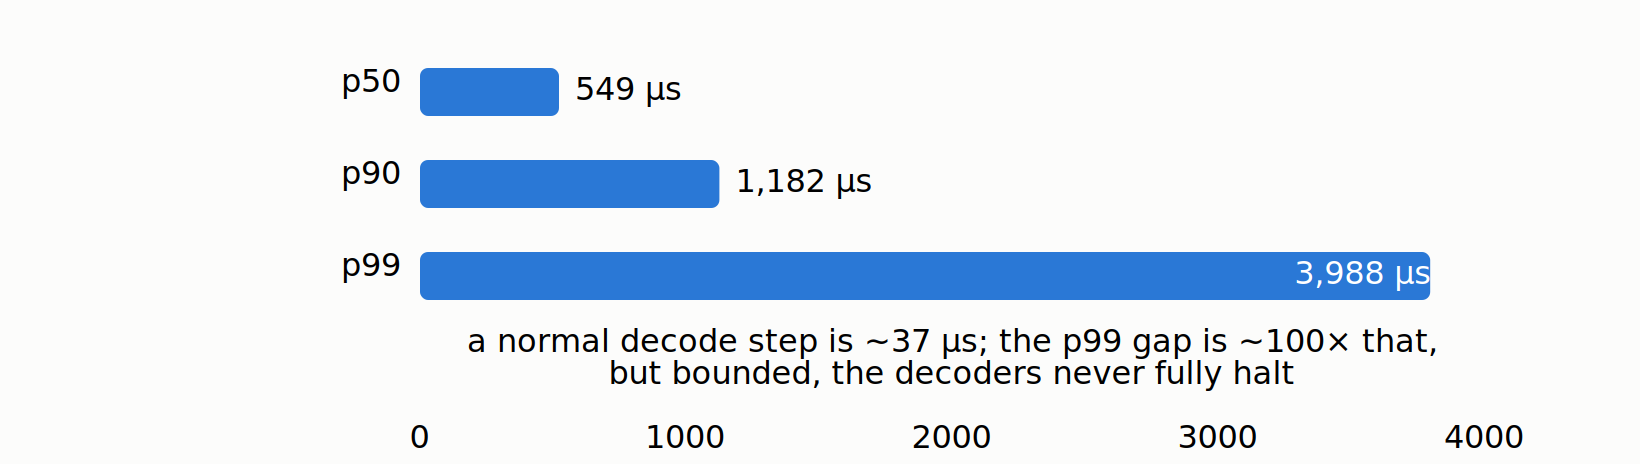
The trace also shows the machine is not wasting the slower beats. Within the pure-decode stretch, the idle gap between consecutive decode kernels is p50 549 microseconds, p99 3,988 microseconds, and inside even the widest gaps the GPU is ~97% busy running the other layers of the step. No dead air anywhere; the freeze was never the GPU idling, it was the scheduler’s choice about whose work rides in each step.
3. Full and linear layers, side by side. Only the 8 full-attention layers show the
classic flash and varlen_fwd kernels of FlashAttention, the standard kernel for the
growing-KV kind of attention; the 24 linear-attention layers show their own kernel family
and no growing-KV attention at all. The split between the two kinds of layer is legible
directly in the kernel mix. This is the same hybrid architecture that gave the model its generous KV
budget in Part 1, now seen from the GPU’s side.
What to take away
- Averages lie about scheduling problems. The victim p50 was flat at 21 ms in every config; the entire story was in the p99. If you monitor mean ITL you will never see a prefill freeze, and your users will.
- Chunked prefill is worth having on a real model. Under heavy prefill load it cut the victim tail by about 2.4x, roughly 830 ms down to 345 ms. It is on by default in vLLM’s V1 scheduler for good reason; the value is in protecting streaming requests from fat incoming prompts.
- A percentile means nothing without the population behind it. The light-injection result flipped sign depending on whether the p99 was computed over all tokens or just the injection window. Before you trust a tail number, ask what set of samples it was computed over.
- Whether an optimization “works” depends on the model scale you test it on. The exact same flag was un-measurable on a 0.5B and clearly beneficial on a 4B. Always ask whether your test model is big enough for the effect you are trying to measure to exist.
- Traces turn “I think it stalls” into “here is the slower heartbeat.” The kernel counts, a single 6k prefill issuing ~34x more kernel launches than the whole decode stream, and the step cadence, ~39 ms while the prefill is interleaved against ~22 ms after, show the same shape the client-side ITL did: the stall is real and it is bounded, not a full halt. When an independent trace shows the same mechanism the client numbers implied, you can trust it.
Next in the series: the flag from this post protected the decoders from one fat prompt, but the deeper lever is running many requests together at all. I turn batching off entirely and watch throughput fall off a cliff, then measure exactly what running requests side by side buys you and where that stops helping.
Reproduce: chunked_prefill_probe.py, capture_trace.py, and the server launch script
are in
experiments/02-prefill-freeze/;
the probe logs, the op-table summary, and the captured chunked_prefill_trace.json.gz
(openable in chrome://tracing) are in
benchmarks/02-prefill-freeze/.
Single A10G; your absolute numbers will differ, the shape will not.
Reading the trace yourself: the quickest visual is to gunzip it and open the .json in
chrome://tracing or ui.perfetto.dev. For numbers rather than
pictures, query it with the perfetto Python
package, which runs PerfettoSQL over the trace; a one-line
select name, count(*), sum(dur) from slice group by name gives the kernel-family counts
and CUDA time. Every trace-derived number and figure in this post is reproduced by the
scripts in the experiments folder: tp_verify.py for the kernel-family counts and the
decode-to-decode gap percentiles, tp_gap_reconcile.py for the gap methodology,
tp_occupancy.py for the GPU-busy fraction, and render_heartbeat.py for the step-cadence
figure above. No GPU is needed to read a captured trace, only to record one. If you would
rather not install anything, the raw .json is a Chrome-trace event list you can parse
with the standard library; each GPU kernel is an event with a category, a timestamp, and
a duration.
Previous: Part 1: Hit the wall · Next: Part 3: The batching cliff · All posts
Disclaimer: This blog is written and published in my personal capacity. The opinions, findings, and conclusions expressed herein are solely my own and do not necessarily represent the views, policies, or endorsements of my current or past employers.