The batching cliff: what running requests together actually buys you
Part 3 of “The Inference Wall”. Same rig as the rest of the series: Qwen3.5-4B, fp16, one NVIDIA A10G (23 GB), under real load.
Manas Pathak · September 4, 2026
The Inference Wall · All posts · Part 3
Part 1 ended on a wall: the 4B model saturating at about seven requests a second, held back not by running out of memory but by the decode loop, the raw rate at which the GPU can generate output tokens. If this is the first post you have landed on, the short version: the model answers in two phases, reading your prompt, then emitting the answer one token at a time. That second phase is “decode,” and it is the one that sets the pace here. Part 1 also gave us the numbers this post turns on: a single request pays about 20 ms per token, which caps a server handling requests one at a time near 50 tokens a second, while a busy server pushes past a thousand. That ~22x gap is not the GPU getting faster under load. It is batching: the server running many requests together on the same hardware at the same time. Batching is the single most important reason one GPU can serve more than one user at a time, and this post measures exactly what it buys, and what it costs.
To measure what batching buys, I turn it off on purpose. vLLM has a knob, max_num_seqs, that caps how
many requests it will run concurrently, the size of the “running batch.” Its default is
a generous 256. I turned it down, all the way to 1, meaning requests are handled
strictly one at a time, and swept upward, flooding the server at each setting with the
same fixed 256/128 workload and measuring sustained throughput. Turning it to 1 is the “what if we didn’t
batch at all” experiment, and the result is the cliff this post is named for.
Why batching works at all: amortizing the weight read
The mechanism is the one from the primer: one weight-stream per step, shared across the whole batch, so the per-request cost falls as the batch grows. Batching does not make any one request faster; it spreads a fixed cost over more beneficiaries.

Batching is a bus: one trip carries the whole crowd, but each passenger still walks their own way home.
One refinement is worth naming, because it is how vLLM and every modern serving engine actually do this. The batch is not formed once and run to completion; it is recomposed at every step, with new requests joining the moment they arrive and finished ones leaving the moment they emit their last token. The technique is called continuous batching, introduced by the Orca paper and standard in vLLM and its peers ever since. This post does not measure continuous against the older run-to-completion style, only batching against no batching; but every number below is continuous batching at work, and the per-step recomposition is the same machinery that let Part 2’s scheduler slip prefill chunks between decode steps.
That predicts the shape before we measure it: throughput should rise steeply as we allow a bigger batch, then flatten once something else becomes the bottleneck. Both halves show up.
The sweep: from one-at-a-time to a full batch
Each row is a separate server launched with a different max_num_seqs cap, then flooded
(--request-rate inf) with the fixed 256-in/128-out workload. Watch the output tok/s
column, that is the aggregate throughput batching is supposed to lift. (Two latency terms
in the table: TTFT is time-to-first-token, how long you wait before the answer starts; ITL
is inter-token latency, the gap between streamed tokens once it does. Both at p50/p99.)
max_num_seqs |
Achieved req/s | Output tok/s | Median TTFT | Median ITL | P99 ITL |
|---|---|---|---|---|---|
| 1 (no batching) | 0.39 | 49 | 60,995 ms | 20.0 ms | 20.5 ms |
| 4 | 1.41 | 181 | 15,700 ms | 20.9 ms | 21.5 ms |
| 16 | 4.29 | 549 | 5,977 ms | 24.3 ms | 70.8 ms |
| 64 | 8.20 | 1,050 | 13,076 ms | 38.8 ms | 364 ms |
| 256 (default) | 8.52 | 1,091 | 54,361 ms | 70.4 ms | 458 ms |
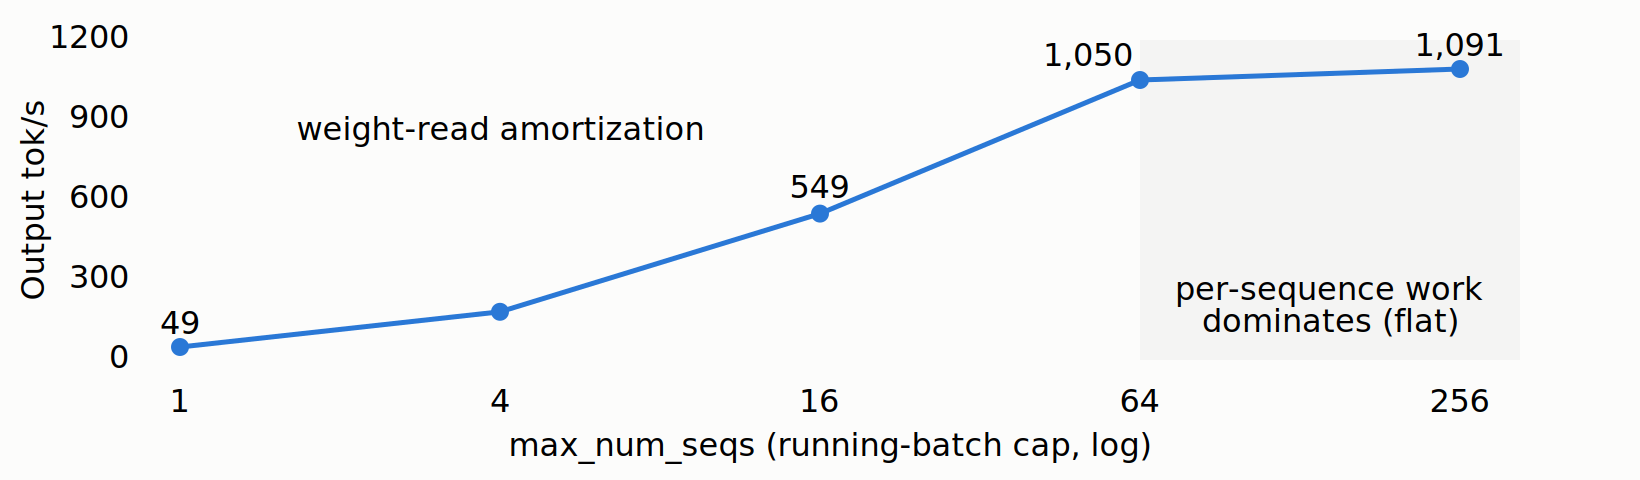
The headline is the first and last rows of the tok/s column: going from one-request-at-a-time to a full batch takes the server from 49 tokens a second to 1,091, a roughly 22x lift on identical hardware, identical model, identical work. That is the batching cliff. Turn batching off and you are running a modern GPU at a small fraction of its capacity, not because it is busy, but because it keeps re-reading the same 8.6 GB of weights to serve one request at a time.
The cliff has a floor: the per-sequence cost that won’t amortize
Look more carefully and the climb is not linear, and it does not go forever. From cap 1 to cap 64, throughput rockets from 49 to 1,050 tok/s, a 21x jump. From 64 to 256 it barely moves: 1,050 to 1,091, under 4%. The batch stopped buying throughput somewhere around 64.
This is Part 1’s wall showing up from a new angle. Batching amortizes the shared weight
read, the one big cost that every sequence in the step splits. But that read is not the
whole per-token cost: each sequence also carries its own work that no other sequence can
share, its slice of the arithmetic and its own smaller memory traffic. As the batch grows,
the shared read is spread ever thinner while this per-sequence part stays fixed, so
eventually the per-sequence part is what each step is spending its time on, and adding more
streams stops lifting throughput. You can see it directly in the numbers: at the ~1,091
tok/s plateau the server is running a batch of about 150, by vLLM’s own Running:
count, which works out to roughly 0.9 ms of work per sequence per token, and that
per-sequence figure barely changes whether the batch is 64 or 150. So the useful range of
max_num_seqs on this model is “big enough to fill the batch” (around 64 here), and
cranking it higher does nothing for throughput.
The per-sequence cost also explains why the 4B’s cliff is 22x and not the 0.5B’s 49x. I ran the same
max_num_seqs sweep on a 0.5B, and its cliff was ~49x. On a tiny 0.5B model the
per-sequence cost is so small that you can pack an enormous batch before it dominates,
so the shared weight read gets amortized much further, hence a steeper cliff. On the 4B the
per-sequence cost is heavier, so amortization saturates earlier and the multiple is
smaller. Same mechanism, and the size of the win scales inversely with how heavy the
per-sequence work is. A bigger model gets less out of batching, not more, which is the
opposite of most people’s intuition. Part 6 turns this into a prediction: the 9B’s
per-sequence cost tracks its weight bytes, not its parameter count, which is the whole
reason quantization pays off.
What batching costs: smoothness and fairness
Batching is not free, and the other columns show the bill. Read the ITL column (the gap between streamed tokens, the “is it typing smoothly” feeling):
- At cap 1, ITL is a flat 20 ms, p50 and p99 nearly identical. The one request in flight has the entire GPU to itself, so every token arrives like clockwork.
- At cap 256, ITL median rises to 70 ms and p99 to 458 ms. Every decode step now advances a big batch, so each individual stream gets its next token less often, and a step that happens to coincide with a fat prefill stretches the tail; that stretch is the freeze Part 2 measured.
So batching trades per-stream smoothness for aggregate throughput. The batched server serves 22x more tokens per second in total, but any one user’s stream is choppier than it would be on an idle machine. That is almost always the right trade: one smooth user on an idle GPU is a rounding error of the machine’s value.
The TTFT column needs one caveat before it tells its story: this sweep floods every cap at
--request-rate inf, so any cap builds a standing queue and shows a large TTFT; cap 256
sits at ~54 s for the same reason. The cross-cap TTFT numbers are therefore not a clean
comparison; the real batching win is the throughput column, 0.39 vs 8.52 req/s. What
cap 1’s number does expose is serialization. At cap 1, median TTFT is 61 seconds, not because the
queue is uniquely deep but because with one running slot requests are served strictly one at
a time: request 40 must wait for the 39 ahead of it to finish entirely before it even
starts. Without batching a busy server does not just run slow, it runs serially, a
single-file line where latecomers wait out everyone ahead of them, and that is the deepest
reason batching matters: it lets the server work on many requests at once instead of lining
them up.
Reading it against the knee from Part 1
This sweep also gives us a consistency check. Part 1 found the 4B saturates around 7 to 8.5 req/s under a request-rate sweep. This post, sweeping batch size under a flood, tops out at 8.20 to 8.52 req/s at caps 64 and 256. Same ceiling, reached two different ways: that tells us we are measuring a real property of the model-plus-GPU and not an artifact of how we drove it. The wall is the wall regardless of which knob you approach it with.
What to take away
- Batching is the difference between a busy GPU and a mostly idle one. One-at-a-time: 49 tok/s. Full batch: 1,091 tok/s. Same hardware, ~22x, purely from sharing each weight read across the requests in flight.
- The batching win has a ceiling: the per-sequence cost that will not amortize.
Throughput climbed hard to batch ~64 and then flattened, because past that the fixed
per-sequence work, not the shared weight read, is what fills each step. Setting
max_num_seqspast the point that fills the batch buys nothing. - Bigger models get less from batching, not more. The 0.5B’s cliff was ~49x; the 4B’s is ~22x, because a heavier per-sequence cost saturates the amortization at a smaller batch. The win runs out sooner.
- Batching costs smoothness and, without it, fairness collapses. Per-stream ITL rose from a flat 20 ms to 70 ms median / 458 ms p99 under a full batch, the price of sharing each step. And with batching off entirely, TTFT ran to 61 seconds because requests serialize into a single-file queue. Aggregate throughput and individual latency pull in opposite directions; batching spends the second to buy the first.
Next in the series: a detour off the rig. I step away from serving under load to open up a small model, GPT-2, on a CPU in full precision, keeping every intermediate value so the arithmetic is slow enough to read, and watch a deep attention head pour almost all its weight onto the first token, a quirk that turns out to sit under two of the hardest problems in serving.
Reproduce: run_batching_sweep.sh, the max_num_seqs sweep with one server per cap, is
in
experiments/03-batching-cliff/;
its output batching_sweep.log and the per-cap batch_server_*.log files are in
benchmarks/03-batching-cliff/.
Single A10G; absolute numbers are rig-specific, the shape and the mechanism are not.
Previous: Part 2: The prefill freeze · Next: Part 4: The attention sink · All posts
Disclaimer: This blog is written and published in my personal capacity. The opinions, findings, and conclusions expressed herein are solely my own and do not necessarily represent the views, policies, or endorsements of my current or past employers.