Quantization to make a model fit: how a 9B model serves at three-quarters of a 4B's speed
Part 6 of “The Inference Wall”. Same rig throughout: one NVIDIA A10G with 23 GB. Qwen3.5-4B in fp16 vs Qwen3.5-9B in 4-bit AWQ.
Manas Pathak · October 1, 2026
The Inference Wall · All posts · Part 6
The wall this series keeps returning to showed up in Part 1: a 4B model on one mid-range GPU, saturating at about seven requests a second, bottlenecked not by memory but by how fast the GPU could copy its weights from HBM to the compute cores on each decode step. Every post since has been about pushing that wall back. This post is about the bluntest lever of all, the one you reach for when the model you want to run does not fit on the GPU, whether because its weights overflow memory or because so little memory is left for the KV cache that the server cannot hold enough concurrent requests to be worth running: quantization.
The model under test is Qwen3.5-9B, about twice the size of the 4B, on the same 23 GB GPU. In its native fp16 format, where each of the model’s numbers is stored in 16 bits, its weights alone are about 18 GB: 9 billion parameters at 2 bytes each. On a 23 GB GPU at vLLM’s default 0.9 memory fraction that leaves under 3 GB for the KV cache, which is why fp16 is not an option here. Even if it loads, a KV budget that small caps the server at a handful of concurrent requests, far below the concurrency the whole exercise is meant to serve, so that degenerate config was not benchmarked. On a 23 GB GPU the practical question is whether the 9B can run at all, and the only form that answers yes is a quantized one.
What makes this worth a post is how small the penalty turns out to be. A 4-bit version of the 9B not only fits, it serves at roughly three-quarters of the 4B’s throughput, about 75%, despite having more than twice the parameters. The rest of the post works out why the penalty is that small, and the answer is the same memory-bandwidth argument the series has made throughout: decode speed tracks the bytes moved per token, and 4-bit weights move far fewer bytes than the parameter count implies.
What quantization actually is
A model’s “weights” are just a giant pile of numbers. By default each is stored in 16 bits,
the format called fp16 or “half precision”. Quantization stores them in fewer bits,
here 4 bits each, using a scheme that picks the 4-bit levels carefully so the numbers stay
close to their originals. What this buys you is space: 4-bit weights take about a quarter of
the bytes of 16-bit weights. The method used here is AWQ, short for Activation-aware
Weight Quantization, a 4-bit scheme designed to choose the levels so the model’s answers
stay close to the fp16 original; vLLM runs it with a fast GPU kernel called awq_marlin.
You do not need the internals; you need one fact, which the rest of the post leans on:
a 4-bit weight is ~4x fewer bytes to read than the same weight in fp16. A real 4-bit
model keeps a few tensors such as the embeddings in higher precision, so the whole-model
shrink is less than a clean 4x, as the memory table below shows.
First, does it fit?
Before any speed number, the memory table, because “it fits at all” is the result that matters most. Here is how vLLM carves up the 23 GB GPU for each model, measured at load:
| Qwen3.5-4B (fp16) | Qwen3.5-9B (AWQ 4-bit) | |
|---|---|---|
| Weights | 8.61 GiB | 11.21 GiB |
| Available KV cache | 9.45 GiB | 6.65 GiB |
| KV cache capacity | 77,088 tokens | 54,384 tokens |
| Max concurrency @ 2,048 tok/req | 83.7x | 59.0x |
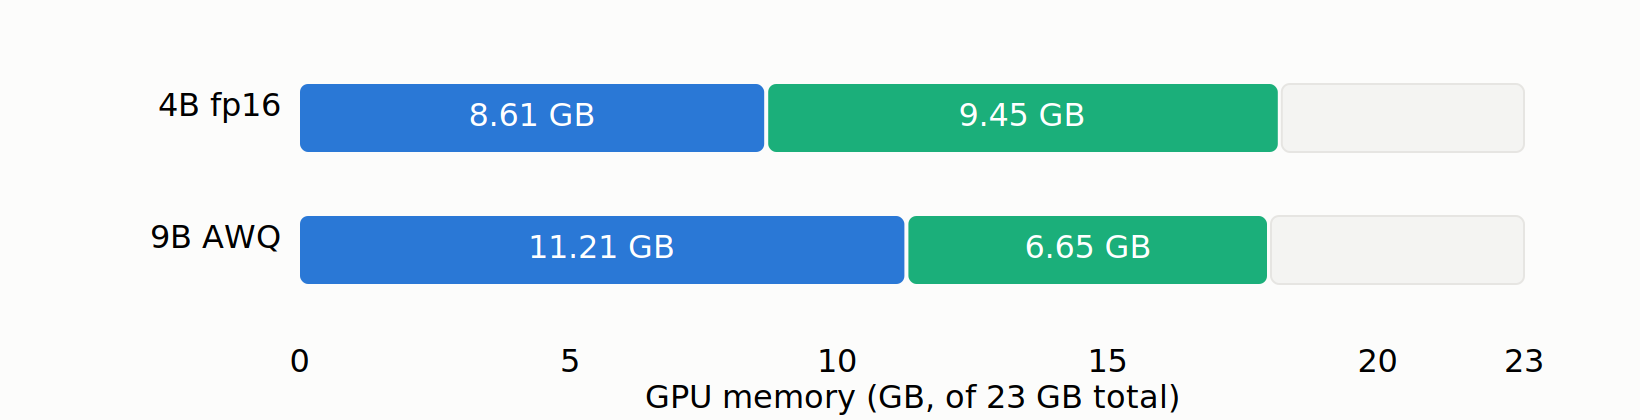
Every cell is quoted from vLLM’s own startup log for each model, the gpu_worker.py
“Available KV cache memory” line and the kv_cache_utils.py “GPU KV cache size” and
“Maximum concurrency” lines, not computed by hand. As Part 1 noted, the concurrency figure
is vLLM’s own hybrid-aware count, not tokens divided by request length.
The weights row is where the result lives. A 9B model in 4-bit weighs 11.2 GiB, only about 1.3x the 4B’s fp16 weights of 8.6 GiB, even though it has 2.25x the parameters. That compression is the entire reason it fits on the GPU at all: 11.2 GiB of weights leaves 6.65 GiB for the KV cache, the server’s per-request working memory, which is still room for 54,000 tokens, or 59 concurrent max-length requests. The fp16 version’s ~18 GiB of weights would have left under 3 GiB for the KV cache, less than half of this, and a serving budget that thin is not worth standing up. Quantization did not make the 9B faster here; it made it usable here. That is the framing to hold onto.
Now the surprise: it serves almost as fast as the smaller model
With the 9B-AWQ actually running, here is its warm serving curve under the same rate sweep this series has used throughout: 256-token in, 128-token out, warm server, percentiles. The latency columns: TTFT is time-to-first-token, the wait before the answer starts; ITL is inter-token latency, the gap between streamed tokens; E2E is the end-to-end total.
| Offered rate | Achieved req/s | Output tok/s | TTFT p50 | TTFT p99 | ITL p99 | E2E p99 |
|---|---|---|---|---|---|---|
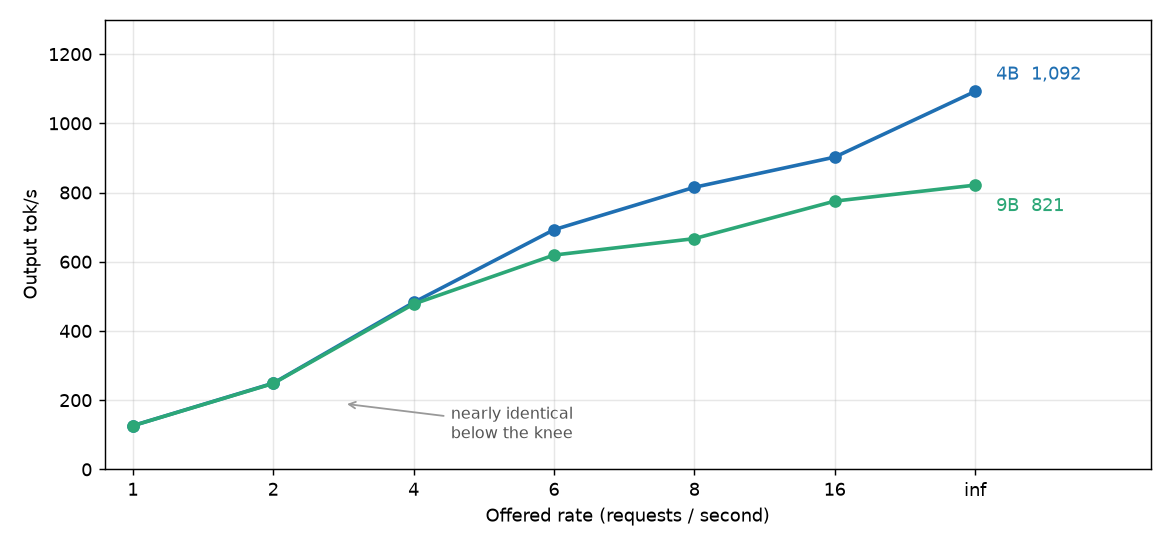
| 1 /s | 0.99 | 126 | 136 ms | 214 ms | 63 ms | 3,799 ms |
| 2 /s | 1.94 | 248 | 146 ms | 267 ms | 73 ms | 4,456 ms |
| 4 /s | 3.73 | 478 | 195 ms | 401 ms | 135 ms | 7,475 ms |
| 6 /s | 4.84 | 619 | 581 ms | 2,911 ms | 342 ms | 20,405 ms |
| 8 /s | 5.21 | 667 | 1,011 ms | 7,403 ms | 457 ms | 20,697 ms |
| 16 /s | 6.06 | 775 | 2,550 ms | 12,998 ms | 612 ms | 25,363 ms |
| inf | 6.42 | 821 | 7,649 ms | 23,275 ms | 612 ms | 31,142 ms |
Now put it next to the 4B fp16 from Part 1, at the same offered rates:
| 4B fp16 | 9B AWQ | |
|---|---|---|
| req/s at rate 4 | 3.77 | 3.73 |
| tok/s at rate 4 | 482 | 478 |
| Sustained req/s ceiling | ~7 to 8.5 | ~6.4 |
| Sustained tok/s ceiling | ~1,000 to 1,090 | ~820 |
Below the knee the two models are nearly identical: at rate 4 the 9B does 3.73 req/s and 478 tok/s against the 4B’s 3.77 and 482, a difference you would not notice. The ceiling is only modestly lower: the 9B tops out at 6.42 req/s and 821 tok/s versus the 4B’s 8.53 and 1,092, which is about 75% of the 4B’s sustained rate (6.42/8.53 = 0.75; 821/1,092 = 0.75). A model with 2.25x the parameters serves at roughly three-quarters of the smaller model’s rate. If you expected the bigger model to be roughly twice as slow, this should be the surprise of the post.
Why the bigger model isn’t much slower: it’s the bytes, not the parameters
The explanation is the per-sequence cost from Parts 1 and 3: the slice of each decode step that a sequence cannot share with the others, which is what sets the ceiling. That cost is governed by how many bytes of weights move per token, not by the parameter count. So bytes per token is the number to compare between two models.
And that reframes this comparison completely. Read the weights row of the table again: the 9B in 4-bit weighs 11.2 GiB against the 4B-fp16’s 8.6 GiB, only about 1.3x the bytes even though it has 2.25x the parameters. Quantization took a would-be ~2.25x increase in bytes-per-token and compressed it to ~1.3x.
The traces settle which ratio the ceiling follows. Sweeping the batch size and fitting the per-step decode time splits it into a fixed cost plus a per-sequence cost, and the per-sequence term is where model size shows up: 313 us/seq for the 4B and 395 us/seq for the 9B, a ratio of 1.26x. That matches the byte ratio (1.30x) and is nowhere near the parameter ratio (2.25x). So the per-sequence cost, and therefore the sustained-throughput ratio, tracks bytes, not parameters. The byte ratio predicts a throughput of ~1 / 1.3 ≈ 77% of the 4B’s; the measured ceiling is 75% (821 vs 1,092 tok/s), close to that. Both are far from the ~45% (~1 / 2.25) the parameter count would imply. If parameters set the cost, the 9B would run at that ~45%; because bytes set it, and quantization held bytes to 1.3x, it runs at three-quarters the speed. That is the whole point: a decode step spends its time moving bytes, so a model with more than twice the parameters but only 1.3x the bytes serves at nearly the same speed.

The cost side
The 4-bit path is not a pure win, and the curve shows where it pays:
- Higher per-token latency at load. At a matched offered rate the 9B’s ITL p99 runs
higher than the 4B’s (342 ms vs ~130 ms at rate 6). Most of that is position on the curve,
not the model: the 9B’s ceiling is lower, so at the same offered rate it is nearer
saturation and its queue inflates sooner. The
awq_marlinkernel also has to dequantize the 4-bit weights each step, a small extra per-step cost the fp16 path skips, but that is the minor term: the measured per-sequence cost is only 1.26x the 4B’s, nowhere near the 2.6x the ITL gap at rate 6 might suggest. - A lower ceiling. The 9B saturates around 6.4 req/s vs the 4B’s ~7 to 8.5, roughly a fifth to a quarter lower sustained throughput.
- Possible quality loss, which I did not measure here. Rounding every weight to 4 bits is lossy, so a quantized model can answer slightly worse than its fp16 self. AWQ exists precisely to keep that loss small, and published evaluations of 4-bit AWQ generally report small drops on standard benchmarks, but “generally small” is not “zero,” and it varies by model and task. This post measured throughput and latency, not accuracy, so I am not claiming the 9B-AWQ answers as well as the 9B in fp16 would. If output quality is what you care about, that is its own benchmark to run, on your own task, before you ship a quantized model.
So the trade is real: you spend some steady-state speed, some smoothness, and possibly a little answer quality to buy the ability to run a model that otherwise would not load. When the alternative is not running the model at all, that trade is overwhelmingly worth it. When you already have headroom, it is a genuine judgment call, and the curve above, plus a quality eval on your own task, is what lets you make it rather than guess.
One check on different hardware, so it stays out of the main comparison: on a separate rig I ran 4-bit against fp16 head-to-head inside a single model, and the same shape held. The int4 win is mostly a property of quantization itself rather than of any one serving engine, so the bytes-read mechanism should carry over beyond this setup.
What to take away
- Quantization’s first job is to make a model fit, not to make it fast. In fp16 the 9B’s ~18 GiB of weights would leave under 3 GiB for the KV cache on this GPU, too little to serve real context; 4-bit AWQ dropped the weights to 11.2 GiB and left room for 59 concurrent requests. Turning “cannot serve enough concurrent requests to be worth it” into “serves 59 at once” is a bigger lever than any percentage speedup.
- Parameter count is the wrong unit for decode speed; bytes-read is the right one. The 9B has 2.25x the parameters but, in 4-bit, only ~1.3x the weight bytes of the 4B in fp16, which is why it serves at ~75% of the speed (the byte ratio predicts ~77%) rather than the ~45% the parameter count would suggest.
- The 4-bit path costs you smoothness, ceiling, and possibly a little accuracy. Expect modestly higher ITL under load and a throughput ceiling a fifth to a quarter lower. 4-bit rounding is also lossy, so answer quality can slip; AWQ is built to keep that small, but I did not measure it here, so treat quality as its own benchmark to run on your task.
- Measure the curve before you decide. If the model does not fit, quantize it. If it already fits with cache headroom to spare, the throughput you give up may not be worth it. The rate sweep, the same one Part 1 used to find the wall and Part 3 used to price batching, is what tells you which case you are in and what the trade actually costs.
That ties back to where the series started. Part 1 found the wall, an ordinary GPU running out of decode throughput long before it runs out of memory. The posts since read the trace to see the wall and pushed it back with scheduling. This one shows the other direction: when the model is too big for the GPU, quantization changes the bytes-per-token math so directly that a model which could not serve usefully becomes one that runs at nearly full speed. The recurring lesson is the same one that runs under every post: on this hardware, inference is a bytes-through-memory problem, and every real win comes from moving fewer bytes.
Reproduce: run_sweep_9b.sh (the QuantTrio/Qwen3.5-9B-AWQ sweep) and verify_load.py
(the memory split) are in the companion repo under
experiments/06-quantization/;
raw logs q35_9b_sweep.log, q35_9b_warm.log, and q35_9b_server.log, plus the decode
traces, are in
benchmarks/06-quantization/
and back every AWQ number here. The 4B comparison curve and its traces are Part 1’s, in
benchmarks/01-hit-the-wall/,
not duplicated. The fp16 9B was not run on this GPU, deliberately: its ~18 GiB weight figure
is 9B x 2 bytes, and the “under 3 GiB left for KV” follows from the same 0.9 memory fraction
the AWQ run used, so the “not worth serving in fp16” call is an estimate, not a measured OOM.
Single A10G; absolute numbers are rig-specific, the bytes-read mechanism is not.
Previous: Part 5: Starving the cache · Next: Part 7, coming next Friday · All posts
Disclaimer: This blog is written and published in my personal capacity. The opinions, findings, and conclusions expressed herein are solely my own and do not necessarily represent the views, policies, or endorsements of my current or past employers.